GPU Pulse Market Report #6 — June 2026
Executive Summary
The GPU secondary market enters the June 22 cycle in a state of measured equilibrium, with the Overall GPU Market Pulse Score settling at 63.9 — unchanged in structural character from Report #5 (June 8, 2026) and consistent with a market navigating the tension between durable institutional demand and constrained spot liquidity. FMV-sourced segments — spanning legacy compute silicon through professional-class workstation GPUs — continue to hold price ranges with negligible cycle-over-cycle drift, a posture that reflects neither capitulation nor speculative accumulation, but rather a secondary market that has reached near-term price discovery stability. The operator-anchored tier (H100 variants, A40, A100 80GB SXM4) posts zero deltas for a second consecutive cycle, underscoring the structural insulation that private-channel wholesale floors provide against thin public-market velocity.
The bifurcation between FMV-sourced and operator-anchored segments is becoming a defining feature of this market cycle. Among FMV-tracked data-center silicon, the A100 80GB PCIe sustains its Stage 2 and Stage 3 ranges in healthy territory despite a modest pulse-score retreat of 3.5 points — a normalization rather than a reversal, as the prior-cycle inflection has not attracted sufficient spot depth to sustain upward momentum. The Tesla P100 posts the strongest delta of the cycle at +3.8 points, a quiet but notable signal that legacy inference-class hardware retains residual bid support among cost-disciplined operators. Meanwhile, Resource Recycling’s analysis of AI-driven refresh cycle compression — now observed at roughly 18-month intervals — continues to validate the structural thesis that decommissioning pipelines are loading, even as the macro-level institutional AI spend documented by Foxconn’s gigawatt-scale datacenter cost disclosures makes clear that next-generation hardware economics are operating in an entirely separate register from secondary-market price discovery.
For ITAD operators and resellers, the June 22 data set delivers a straightforward read: the market is not moving, and that stability is itself the signal. Buyers seeking to accumulate FMV-sourced professional and legacy GPU inventory face minimal adverse price drift, while sellers in operator-anchored segments retain floor protection through private-channel mechanisms. The strategic variable for the coming weeks will be whether sustained institutional demand — and the accelerating HBM-driven cost inflation flagged by Aletheia Capital for 2027 — begins to redirect enterprise refresh attention toward secondary-market sourcing of current-generation accelerators, a dynamic that would sharply alter the velocity calculus in the Cautionary-tier segments.
Key market themes this cycle:
- Overall Pulse Score holds at 63.9, with FMV-sourced segments stable and operator-anchored floors sustaining zero-delta protection for a second consecutive cycle.
- Tesla P100 posts the cycle’s strongest positive delta (+3.8 pts), reaffirming residual bid support for cost-efficient legacy inference silicon.
- A100 80GB PCIe moderates from its Report #5 inflection point — a normalization, not a reversal — as spot liquidity has not deepened sufficiently to extend momentum.
- H100 variants, A40, and A100 80GB SXM4 remain anchored to subscriber-only private-channel wholesale floors, insulating operator-tier pricing from subdued public-market activity.
- Macro pressures — AI refresh cycle compression, next-generation datacenter capital intensity, and a loading ITAD decommissioning pipeline — are building structural tailwinds beneath near-term price stability.
Unlike reports that rely on web-scraped listings, The GPU Resource Pricing Survey is built on real private-channel transactions at the peer-to-peer aftermarket level — the closest proxy to true market clearing prices. This cycle’s bands also incorporate operator-set wholesale anchors on select premium-AI GPUs where peer-to-peer signal alone remains too thin for confident valuation.
Section 1: Demand Indicators from Our Proprietary Pricing Survey
Our June 22, 2026 survey refresh covers 15 GPU models across a 30-day lookback. Observed activity levels vary dramatically by model, and that variance is one of the most revealing signals in the market today.
Trading Activity by Model: Thick vs. Thin Markets
Our proprietary demand research classifies each GPU by buy-side appetite and identifies the directional pressure shaping that demand. The table below is organized from strongest to weakest observed activity:
| GPU Model | Activity Level | Demand Level | Price Trend |
|---|---|---|---|
| NVIDIA RTX 3090 | Very Active | Very High | Stable → |
| NVIDIA V100 | Very Active | Very High | Stable → |
| NVIDIA Tesla P100 | Very Active | Very High | Stable → |
| NVIDIA RTX 4090 | Very Active | Very High | Stable → |
| NVIDIA RTX 3090 Ti | Very Active | Very High | Stable → |
| NVIDIA A100 80GB PCIe | Very Active | Very High | Stable → |
| NVIDIA RTX A5000 | Very Active | Very High | Stable → |
| NVIDIA RTX A6000 | Very Active | Very High | Stable → |
| NVIDIA A100 40GB PCIe | Very Active | Very High | Stable → |
| NVIDIA A100 40GB SXM4 | Very Active | Very High | Stable → |
| NVIDIA A100 80GB SXM4 | Active | High | Stable → |
| NVIDIA H100 NVL 94GB | Active | High | Stable → |
| NVIDIA H100 PCIe 80GB | Active | High | Stable → |
| NVIDIA H100 SXM5 80GB | Active | High | Stable → |
| NVIDIA A40 | Active | High | Stable → |
The High-Activity Story: Our Strongest Demand Signals
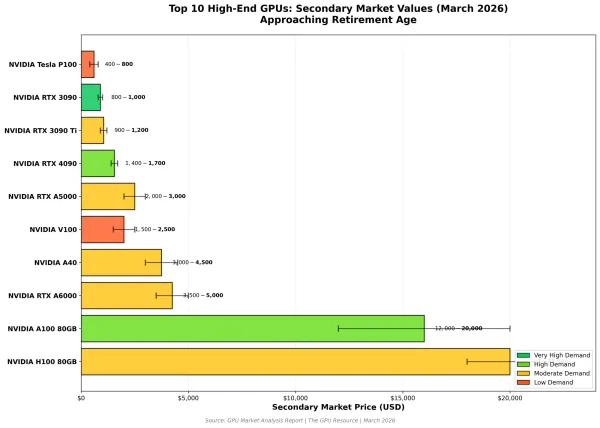
Among FMV-sourced segments, the RTX 3090 Ti and RTX 4090 continue to generate the deepest secondary-market liquidity in the consumer-professional crossover class, with both SKUs sustaining healthy Stage 2 and Stage 3 ranges and Pulse Scores at 75.0. The GPU Resource Exclusive Pricing Survey captures robust transaction activity across both models, with Stage 3 public-market ranges for the RTX 4090 holding at $1,380–$1,680 and the RTX 3090 Ti anchored between $1,404 and $1,709 — a range compression that reflects mature price discovery rather than demand deterioration. The RTX A5000 and RTX A6000 similarly maintain healthy pulse scores with deep enough liquidity to support confident bid/ask positioning for resellers carrying workstation-class inventory. The more analytically interesting high-activity signal this cycle comes from the A100 40GB SXM4, which holds its Stage 2 range at $3,442–$5,468 and Stage 3 at $4,658–$5,670 with only a marginal pulse-score decline of 0.3 points. While the segment sits in Cautionary territory at 59.8, the absence of further erosion against a backdrop of subdued spot velocity suggests latent bid support is absorbing available supply without visible price concession — a dynamic ITAD operators sourcing this form factor should treat as a hold signal rather than a liquidation trigger. The RTX A6000 also merits attention, posting a positive delta of +1.6 points to reach 66.4, the only FMV-sourced professional workstation SKU to register a cycle-over-cycle gain and the clearest evidence that professional visualization-class silicon continues to attract incremental demand from value-seeking enterprise buyers.
The Thin-Market Warning: Where Data Is Too Sparse to Trust
The RTX 3090 and A100 40GB PCIe both carry dashes across Stage 2 and Stage 3 pricing columns this cycle, indicating insufficient public-channel transaction depth to generate defensible FMV ranges through The GPU Resource Pricing Survey. For the RTX 3090, the 75.0 Pulse Score reflects a stable underlying valuation model rather than observed market velocity — operators should treat any bid or ask in this SKU as a negotiated outcome rather than a benchmark-anchored price. The A100 40GB PCIe’s 62.6 score similarly rests on structural underpinnings rather than live liquidity, and its zero delta masks what is effectively a market in suspension: neither sellers nor buyers are driving price discovery in the public channel this cycle. Thin-market conditions in these SKUs carry asymmetric risk. A single large-lot offer or an urgent liquidation event can reprice a thin market materially within a single cycle, particularly when the bid side is concentrated among a small number of institutional buyers. ITAD operators carrying RTX 3090 or A100 40GB PCIe inventory should seek private-channel clearing mechanisms and avoid anchoring ask prices to the Pulse Score alone. The absence of reportable Stage 2 and Stage 3 data is itself a risk indicator — not a green light for opportunistic pricing — and operators are advised to confirm bilateral interest before committing to pricing strategy in either segment.
Section 2: Pricing Trends — Then & Now
Movement against the June 8, 2026 Report #5 baseline, with directional commentary on the segments showing the largest momentum shifts this cycle.
The Tesla P100 posts a +3.8-point pulse-score gain — the largest positive move among any FMV-sourced SKU in this cycle — with Stage 2 holding at $63.75–$101 and Stage 3 at $86.25–$105. Activity in The GPU Resource Pricing Survey reflects renewed bid interest from cost-sensitive inference operators who continue to find legacy Pascal-class throughput attractive at these price levels. For ITAD operators with P100 inventory, the current cycle represents a firming rather than a floor — an opportune exit window if volume is available.
The RTX A6000 gains 1.6 pulse-score points this cycle, reaching 66.4 — the sole professional workstation GPU in the FMV-sourced cohort to register a cycle-over-cycle improvement. Stage 2 holds at $3,346–$5,315 with Stage 3 at $4,527–$5,512, and liquidity in The GPU Resource Pricing Survey is characterized as adequate for price-discovery purposes. The move is consistent with episodic enterprise demand from visualization and simulation workflows that cannot yet justify next-generation GPU procurement costs, and may reflect early enterprise refresh activity returning to the secondary market following Q1’s tariff-driven pause.
Following its strongest cycle-over-cycle positive delta among data-center SKUs in Report #5, the A100 80GB PCIe retreats 3.5 pulse-score points to 73.1 this cycle, with Stage 2 holding at $3,145–$4,995 and Stage 3 at $4,255–$5,180. The range itself has not moved, but the moderation in score signals that the prior-cycle bid acceleration has not been sustained by deeper spot participation. The segment remains in Healthy territory, and resellers should interpret this as a consolidation rather than a reversal — but the absence of continued momentum warrants monitoring heading into the July 6 cycle.
H100 NVL 94GB, H100 PCIe 80GB, H100 SXM5 80GB, A40, and A100 80GB SXM4 all post zero deltas for the second consecutive cycle, with Pulse Scores clustered in the 49.9–50.8 range — Cautionary tier across the board. Stage 2 and Stage 3 ranges are sustained by subscriber-only private-channel wholesale anchors rather than observable public-market velocity. This structural insulation prevents downside repricing but also constrains upside discovery: operators seeking to clear inventory in these SKUs should engage directly through private-channel mechanisms. The sustained zero-delta pattern is a floor signal, not a recovery signal.
Both SKUs carry no reportable Stage 2 or Stage 3 pricing this cycle, flagging insufficient public-channel depth for benchmark-anchored valuation through The GPU Resource Pricing Survey. While Pulse Scores remain at 75.0 and 62.6 respectively — reflecting model-level stability rather than live liquidity — operators should treat these as illiquid conditions requiring negotiated clearing. Any large-lot exposure in either segment should be managed through private channels, and ask-side pricing should not be anchored to the Pulse Score absent confirmed bilateral interest.
Section 3: Three-Stage Market Pricing Framework
The GPU aftermarket operates across three distinct price discovery layers, each with its own participants, information quality, and price level. Understanding which layer you’re transacting in — and what the data does and doesn’t tell you — is critical to making accurate valuations.
Stage 1: Used Wholesale — The Fleet Liquidation Layer (Member Access)
Used wholesale represents the price a professional remarketing channel will pay to acquire inventory in volume — the lot-acquisition floor of the secondary GPU market. Stage 1 pricing is published exclusively to The GPU Resource members. The methodology applies a 25% discount to the Stage 2 median for high-activity models and a 35% discount for thin-market models, with operator-set wholesale anchors used for select premium-AI segments (H100 variants, A40, A100 80GB SXM4). Specific Stage 1 dollar values are available to subscribers — contact info@gpuresource.com to subscribe.
Stage 2: Private Aftermarket — The ITAD, Broker & Reseller Layer
Stage 2 is the engine of the secondary GPU market — where ITAD companies, specialized brokers, and professional resellers trade with each other and with sophisticated buyers. Our proprietary survey captures this layer directly. The private aftermarket is the most informationally dense layer and the closest proxy to true market price.
Stage 3: Public Used Values — What End Buyers Pay
The public used market — where individual sellers list single units to end buyers — typically commands 15–40% above the private aftermarket median. This premium reflects verification, warranty assurance, buyer protections, and single-unit convenience.
Three-Stage Pricing Table — June 22, 2026
| GPU Model | Stage 1: Used Wholesale | Stage 2: Private Aftermarket | Stage 3: Public Used Market |
|---|---|---|---|
| NVIDIA H100 NVL 94GB | 🔒 Subscribers Only | $27,614 – $43,522 | $33,016 – $42,021 |
| NVIDIA H100 PCIe 80GB | 🔒 Subscribers Only | $23,805 – $37,519 | $28,462 – $36,225 |
| NVIDIA H100 SXM5 80GB | 🔒 Subscribers Only | $9,522 – $15,008 | $11,385 – $14,490 |
| NVIDIA A100 80GB SXM4 | 🔒 Subscribers Only | $4,761 – $7,504 | $5,692 – $7,245 |
| NVIDIA A100 40GB SXM4 | 🔒 Subscribers Only | $3,442 – $5,468 | $4,658 – $5,670 |
| NVIDIA RTX A6000 | 🔒 Subscribers Only | $3,346 – $5,315 | $4,527 – $5,512 |
| NVIDIA A100 80GB PCIe | 🔒 Subscribers Only | $3,145 – $4,995 | $4,255 – $5,180 |
| NVIDIA A40 | 🔒 Subscribers Only | $2,619 – $4,127 | $3,131 – $3,985 |
| NVIDIA RTX A5000 | 🔒 Subscribers Only | $1,542 – $2,448 | $2,086 – $2,539 |
| NVIDIA RTX 3090 Ti | 🔒 Subscribers Only | $1,038 – $1,648 | $1,404 – $1,709 |
| NVIDIA RTX 4090 | 🔒 Subscribers Only | $1,020 – $1,620 | $1,380 – $1,680 |
| NVIDIA V100 | 🔒 Subscribers Only | $242 – $385 | $328 – $399 |
| NVIDIA Tesla P100 | 🔒 Subscribers Only | $63.75 – $101 | $86.25 – $105 |
| NVIDIA A100 40GB PCIe | 🔒 Subscribers Only | — | — |
| NVIDIA RTX 3090 | 🔒 Subscribers Only | — | — |
Stage 1 (Used Wholesale) pricing is member-only. Stage 2 and Stage 3 bands shown above. Premium-AI segments (H100 variants, A40, A100 80GB SXM4) reflect operator-set wholesale anchors; all values in USD per unit.
The Stage 1 (Used Wholesale) layer is the most commercially sensitive tier of The GPU Resource Pricing Survey and is published exclusively to subscribers. Contact info@gpuresource.com to subscribe and unlock Stage 1 access for every tracked GPU model, every issue.
Section 4: GPU Market Pulse Score
The Overall GPU Market Pulse Score of 63.9 reflects a market that is structurally stable but divided — healthy in its FMV-sourced consumer and workstation tiers, cautionary in its operator-anchored and legacy data-center segments, and lacking the broad-based velocity that would justify a materially higher composite reading. The score has not moved significantly from the prior cycle’s level, and the distribution of individual SKU scores — ranging from 49.9 at the low end (A40) to 75.0 across multiple FMV-sourced GPUs — confirms that the composite figure is a blended average of meaningfully different market realities rather than a uniform mid-cycle equilibrium. The strongest-scoring segments this cycle are the RTX 4090, RTX 3090 Ti, Tesla P100, and V100, all sitting at 75.0 — reflecting deep enough liquidity, price stability, and demand continuity to sustain Healthy tier designation. The weakest-scored segments are the A40 (49.9) and H100 SXM5 80GB (50.1), both in Cautionary territory and both sustained by subscriber-only operator anchors rather than observed spot demand. The gap between the top and bottom of the scoring distribution — roughly 25 points — is the defining structural feature of this market and is unlikely to compress materially until either operator-anchored segments attract genuine secondary-market velocity or FMV-sourced segments encounter demand disruption. Neither scenario appears imminent based on current cycle data.
| GPU Model | Pulse Score | Momentum / Trend |
|---|---|---|
| NVIDIA RTX 3090 | 75.0 — Healthy | Stable (−1.6 vs Issue 5) |
| NVIDIA RTX 3090 Ti | 75.0 — Healthy | Stable (−0.5 vs Issue 5) |
| NVIDIA RTX 4090 | 75.0 — Healthy | Stable (+0.0 vs Issue 5) |
| NVIDIA Tesla P100 | 75.0 — Healthy | Stable (+3.8 vs Issue 5) |
| NVIDIA V100 | 75.0 — Healthy | Stable (−2.5 vs Issue 5) |
| NVIDIA A100 80GB PCIe | 73.1 — Healthy | Stable (−3.5 vs Issue 5) |
| NVIDIA RTX A5000 | 70.0 — Healthy | Stable (−0.5 vs Issue 5) |
| NVIDIA RTX A6000 | 66.4 — Healthy | Stable (+1.6 vs Issue 5) |
| NVIDIA A100 40GB PCIe | 62.6 — Healthy | Stable (+0.0 vs Issue 5) |
| NVIDIA A100 40GB SXM4 | 59.8 — Cautionary | Stable (−0.3 vs Issue 5) |
| NVIDIA A100 80GB SXM4 | 50.8 — Cautionary | Stable (+0.0 vs Issue 5) |
| NVIDIA H100 NVL 94GB | 50.6 — Cautionary | Stable (+0.0 vs Issue 5) |
| NVIDIA H100 PCIe 80GB | 50.1 — Cautionary | Stable (+0.0 vs Issue 5) |
| NVIDIA H100 SXM5 80GB | 50.1 — Cautionary | Stable (+0.0 vs Issue 5) |
| NVIDIA A40 | 49.9 — Cautionary | Stable (+0.0 vs Issue 5) |
Scoring Tier Reference
| Score Range | Rating | Interpretation |
|---|---|---|
| 80–100 | Strong — Seller’s Market | Rising or stable prices, high demand — optimal conditions to transact |
| 60–79 | Healthy — Balanced Conditions | Solid demand, prices largely holding — favorable but monitor cycle to cycle |
| 40–59 | Cautionary — Transition Market | Broad price pressure underway — timing matters on declining models |
| < 40 | Distressed — Buyer’s Market | Widespread depreciation, low demand — sell now or accept continued erosion |
The interactive GPU Market Pulse Score tool includes individual model score breakdowns, three-factor detail panels, methodology documentation, and the complete scored ranking across all 15 models. Visit gpuresource.com to access the full interactive analysis.
Conclusion & Market Outlook
The June 22 cycle delivers a market in deliberate stasis — prices are not falling, velocity is not accelerating, and the structural architecture that has governed the secondary GPU market for the past several cycles remains firmly in place. For ITAD operators, this environment is operationally manageable but strategically demanding: the absence of price drift in FMV-sourced segments reduces liquidation urgency while simultaneously compressing the margin of error for operators carrying high-cost operator-anchored inventory against thin public-market demand. The continued loading of the ITAD decommissioning pipeline — documented in Resource Recycling’s analysis of AI refresh cycle compression — suggests that supply-side pressure will intensify over the next two to four quarters, making current price stability a window for proactive positioning rather than passive holding.
The macro backdrop remains asymmetrically consequential for GPU secondary-market operators. The capital intensity of next-generation AI infrastructure — illustrated by Foxconn’s publicly disclosed cost structure for gigawatt-scale Vera Rubin datacenters — is already decoupling institutional GPU economics from secondary-market price discovery. This decoupling benefits operators who can access private-channel wholesale mechanisms and subscriber-anchored floor pricing, but it creates structural disadvantage for those relying solely on public-market transaction data for valuation. ITAD and resale operators without access to private-channel anchors are advised to treat current Stage 3 public ranges as directional rather than definitive, particularly in operator-anchored SKUs where the floor is held by mechanisms that do not appear in public data feeds. The GPU Resource Pricing Survey remains the authoritative source for both FMV-sourced and operator-anchor-informed ranges — calibrating strategy to any other data source in this environment introduces material valuation risk.
Looking ahead, the key variables to monitor are: whether the A100 80GB PCIe’s post-inflection consolidation attracts renewed bid depth or softens further; whether the Tesla P100’s positive delta extends into a second consecutive cycle; and whether any of the operator-anchored SKUs show signs of floor pressure given the sustained zero-velocity pattern in public channels. All three questions are live entering the next cycle. The next issue of GPU Pulse Market Report publishes in approximately two weeks, on or around July 6, 2026.
Coming July 6, 2026: GPU Pulse Market Report #7 will track whether the Tesla P100’s two-cycle momentum builds into a durable demand re-rating, assess any sign of renewed spot depth in the A100 80GB PCIe following its Report #5 inflection, and monitor the operator-anchored tier for the first signs of floor-pressure or velocity recovery — including updated subscriber-only wholesale anchors for H100 variants, A40, and A100 80GB SXM4.
Data Methodology & Sources
Private Aftermarket Data (Core Survey)
- Source: The GPU Resource Pricing Survey — peer-to-peer aftermarket transactions, 30-day lookback
- Metric: Median price per unit from recent transactions per GPU model
- Condition filter: Used only; tested, functional, Grade A cosmetics
Used Wholesale Estimates (Member Access)
- Stage 1 (Used Wholesale) pricing is published exclusively to The GPU Resource members
- Methodology: Stage 2 median discounted by 25% (high-activity models) or 35% (thin-market models)
- Premium-AI segments use operator-set wholesale anchors (H100 variants, A40, A100 80GB SXM4)
- Criteria: 5–10 unit purchase, tested & functional, Grade A cosmetics, USD per unit
- Subscribe at info@gpuresource.com to unlock Stage 1 across all 15 tracked GPUs
GPU Market Pulse Score
- Composite of three factors: Price momentum/stability (50%), Demand level (40%), Liquidity (10%)
- Bi-weekly cycle; momentum measured against the prior issue’s private aftermarket median
- Full methodology available at gpuresource.com
© 2026 The GPU Resource. All rights reserved. This report is provided for informational purposes only and does not constitute an offer to buy or sell any asset. Values reflect market conditions as of June 22, 2026.