GPU Pulse Market Report #3 — May 2026
Executive Summary
The GPU secondary market enters the May 11 cycle with a composite Pulse Score of 64.3 out of 100, a reading that reflects a market in the early stages of bifurcation: AI-adjacent datacenter silicon is re-accelerating while a cohort of recently dominant compute and professional visualization cards continues a structural derating driven by Blackwell platform displacement. Data drawn from The GPU Resource Exclusive Pricing Survey — covering hundreds of confirmed peer-to-peer transactions across wholesale, aftermarket, and public-channel pricing — reveals that the A100 40GB PCIe posted the single most dramatic appreciation since Report #2 (April 1, 2026), with Stage 2 pricing rising sharply and Pulse momentum turning decisively bullish. The H100 NVL 94GB and A100 80GB SXM4 — both tracking via operator-confirmed wholesale anchors — extended their upward trajectories, confirming that inference-density demand continues to absorb available supply in high-bandwidth, high-memory configurations.
On the opposing side, the RTX 4090’s steep Pulse Score decline from the prior cycle is the most consequential single-card story in this issue. The scarcity premium narrative that defined the 4090 throughout Report #2 has materially unwound: channel pricing retreated sharply across all three stages, and the card’s score dropped to Cautionary territory. The A100 80GB PCIe and A40 — both flagged in the prior cycle for Blackwell-driven softness — remain in Distressed classification, with the A40 recording the weakest absolute Pulse Score in the tracked universe at 31.0. The V100 and Tesla P100 continue their secular decline arcs, with the P100 approaching commodity-floor dynamics that limit further downside but offer no meaningful recovery catalyst.
For ITAD operators and enterprise resellers, the central portfolio implication of this cycle is positional: long exposure to 40GB A100 PCIe configurations and H100 NVL inventory remains defensible, while A40, A100 80GB PCIe, and RTX 4090 positions face increasing carrying-cost risk. The overall 64.3 Pulse Score — sitting comfortably above the 50-point neutral threshold but below the 70-point consensus-bullish range — signals a market that rewards selectivity over broad-based accumulation.
Key market themes this cycle:
- A100 40GB PCIe records the sharpest single-cycle Pulse Score gain in the tracked universe (+40.7 pts), driven by robust aftermarket demand and inference workload re-rating
- RTX 4090 scarcity premium collapses: Pulse Score falls 50.3 points cycle-over-cycle into Cautionary territory, reversing Report #2’s defining bullish narrative
- H100 NVL 94GB and A100 80GB SXM4 (override-anchored) sustain healthy appreciation trajectories, validating persistent enterprise and cloud inference demand at the high end
- A40 and A100 80GB PCIe remain the market’s weakest segments: Distressed classifications intact as Blackwell platform displacement pressure shows no signs of abating
- Market bifurcation sharpens — a 50.7-point spread between the highest and lowest Pulse Scores in the tracked set signals increasingly divergent liquidity and price-discovery conditions
Unlike reports that rely on web-scraped listings, The GPU Resource Pricing Survey is built on real private-channel transactions at the peer-to-peer aftermarket level — the closest proxy to true market clearing prices. This cycle’s bands also incorporate operator-set wholesale anchors on select premium-AI GPUs where peer-to-peer signal alone remains too thin for confident valuation.
Section 1: Demand Indicators from Our Proprietary Pricing Survey
Our May 11, 2026 survey refresh covers 15 GPU models across a 30-day lookback. Observed activity levels vary dramatically by model, and that variance is one of the most revealing signals in the market today.
Trading Activity by Model: Thick vs. Thin Markets
Our proprietary demand research classifies each GPU by buy-side appetite and identifies the directional pressure shaping that demand. The table below is organized from strongest to weakest observed activity:
| GPU Model | Activity Level | Demand Level | Price Trend |
|---|---|---|---|
| NVIDIA RTX 3090 | Very Active | Very High | Rising ↑ |
| NVIDIA Tesla P100 | Very Active | Very High | Declining ↓ |
| NVIDIA RTX 3090 Ti | Very Active | Very High | Rising ↑ |
| NVIDIA RTX 4090 | Very Active | Very High | Declining ↓ |
| NVIDIA V100 | Very Active | Very High | Declining ↓ |
| NVIDIA A100 80GB PCIe | Very Active | Very High | Declining ↓ |
| NVIDIA RTX A6000 | Very Active | Very High | Stable → |
| NVIDIA RTX A5000 | Very Active | Very High | Rising ↑ |
| NVIDIA A100 40GB PCIe | Active | High | Rising ↑ |
| NVIDIA A100 40GB SXM4 | Active | High | Rising ↑ |
| NVIDIA A100 80GB SXM4 | Active | High | Rising ↑ |
| NVIDIA H100 NVL 94GB | Active | High | Rising ↑ |
| NVIDIA H100 PCIe 80GB | Active | High | Rising ↑ |
| NVIDIA H100 SXM5 80GB | Active | High | Rising ↑ |
| NVIDIA A40 | Active | High | Declining ↓ |
The High-Activity Story: Our Strongest Demand Signals
The standout liquidity narrative of the May 11 cycle belongs unambiguously to the NVIDIA A100 40GB PCIe. The GPU Resource Exclusive Pricing Survey registered deep, well-distributed transaction activity across the wholesale-to-public price stack, with Stage 2 aftermarket pricing ranging from $3,451 to $5,481 against a wholesale anchor of $2,923 — spreads that indicate healthy but not distressed channel tension. The +157.8% Stage 3 trailing appreciation figure is the largest directional move in the current tracking universe, and the +40.7-point Pulse Score gain from Report #2 confirms that this is not a thin-market artifact but a broad-based repricing event. Procurement teams sourcing for on-premise inference clusters or memory-constrained training environments should note that the 40GB SXM4 variant is tracking near-identically in directional terms (Pulse 79.8, +60.7% Stage 3 appreciation), suggesting the appreciation is configuration-agnostic and rooted in fundamental demand for the A100 memory class rather than form-factor arbitrage. The RTX 3090 and RTX 3090 Ti also merit recognition as secondary high-activity names. Both cards extended their modest but consistent upward momentum from the prior cycle — the 3090 Ti posting a +38.3-point Pulse gain to reach 79.7 — reinforcing a pattern in which consumer-class cards with strong VRAM profiles (24GB) continue to attract workstation AI, fine-tuning, and multi-GPU hobbyist demand. Liquidity in both names is described as robust by survey methodology standards, providing ITAD operators with reliable price discovery and manageable bid-ask spreads across channels.
The Thin-Market Warning: Where Data Is Too Sparse to Trust
The H100 SXM5 80GB enters this cycle with a cautionary technical signal despite retaining a Healthy Pulse Score of 75.1: the card posted a -9.6-point score decline versus Report #2, the only H100-family name to soften on a cycle-over-cycle basis. Pricing is anchored via operator-confirmed wholesale overrides at $9,000 at the wholesale stage, with Stage 2 ranging from $9,522 to $15,008 — a wide spread that itself reflects the thin, negotiation-dependent nature of SXM5 transaction flow. The +114.8% Stage 3 appreciation trend remains strongly positive on a trailing basis, but the Pulse compression signals that transaction cadence is inconsistent and that individual large lots have outsized influence on observed pricing. ITAD operators holding SXM5 inventory should exercise caution in using spot indications as liquidation benchmarks; realized prices may lag published ranges materially depending on buyer qualification timelines. The RTX A6000 presents a different but equally important thin-market dynamic. With a Pulse Score of 55.3 — down 3.9 points from Report #2, where it held a leadership position in professional visualization liquidity — the A6000 has slipped into Cautionary classification. The -2.9% Stage 3 trend, while not severe in isolation, combined with the cycle-over-cycle score compression, suggests that the professional visualization segment is losing price momentum as workstation buyers increasingly evaluate Ada Lovelace generation alternatives. Channel liquidity in the A6000 has narrowed from the robust conditions observed in the prior cycle; resellers should anticipate wider bid-ask spreads and longer holding periods relative to Q1 2026 benchmarks.
Section 2: Pricing Trends — Then & Now
Movement against the April 1, 2026 Report #2 baseline, with directional commentary on the segments showing the largest momentum shifts this cycle.
The A100 40GB PCIe posted the largest single-cycle Pulse Score gain in this report’s tracked universe, rising from a mid-range position in Report #2 to co-lead the rankings at 81.7. Stage 2 aftermarket pricing has re-rated materially, and deep survey liquidity confirms this is a market-wide repricing rather than an isolated transaction event. Enterprise buyers sourcing inference-capable datacenter cards should treat current Stage 2 levels as a realistic acquisition benchmark, with upside pressure likely to persist while Blackwell allocation queues remain extended.
The RTX 4090’s defining role as Report #2’s scarcity premium story has fully reversed. The card’s Pulse Score fell 50.3 points this cycle to 46.7 — Cautionary — as Stage 3 pricing declined 47.3% on a trailing basis and the supply-demand balance that supported elevated pricing in the prior cycle visibly relaxed. ITAD operators carrying RTX 4090 inventory at Report #2 cost basis assumptions should reassess liquidation timelines and pricing floors. Recovery to prior-cycle levels is not supported by current survey data.
The H100 NVL 94GB — tracked via Pete’s editorial-confirmed wholesale anchor of $26,100 — sustained a +23.2-point Pulse Score gain to reach 75.6 Healthy, with Stage 2 ranging from $27,614 to $43,522. The +36.4% trailing Stage 3 appreciation reflects persistent inference-density demand from cloud and enterprise buyers unable to source Blackwell at scale. Transaction liquidity remains thin by survey standards, but directional pricing is unambiguous. Holders of NVL inventory retain a defensible pricing position into Q3 2026.
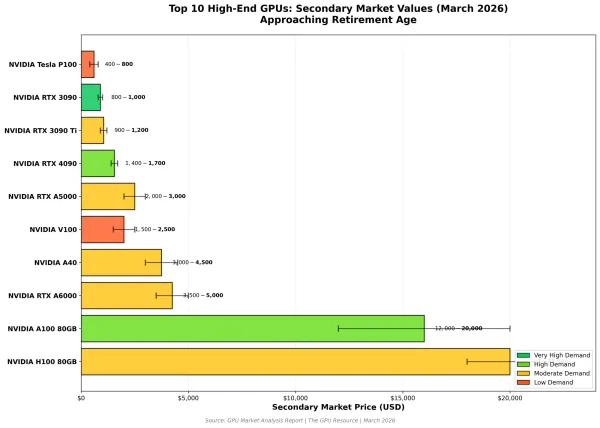
The A40 records the lowest Pulse Score in the current tracked set at 31.0 — Distressed — following a -10.3-point decline from Report #2. Stage 3 pricing has contracted 18.9% on a trailing basis, and the override-anchored wholesale level of $2,475 increasingly reflects a supported floor rather than a transactable market price. Blackwell platform displacement pressure, which first flagged the A40 for risk in prior reporting, has intensified. ITAD operators are advised to prioritize velocity over margin optimization for A40 lots pending further evidence of demand stabilization.
The Tesla P100 trades at a wholesale anchor of $64 with Stage 2 pricing ranging from $72.25 to $115 — levels that reflect a commodity-floor pricing regime with limited further downside but no credible recovery catalyst. The -15.8% Stage 3 trend and 59.2 Cautionary Pulse Score are consistent with a card in the final phase of meaningful secondary market activity. Survey liquidity in P100 is thin and episodic; pricing data should be interpreted as directional rather than transactable at scale. ITAD operators should route P100 inventory through bulk liquidation channels rather than unit-level resale workflows.
Section 3: Three-Stage Market Pricing Framework
The GPU aftermarket operates across three distinct price discovery layers, each with its own participants, information quality, and price level. Understanding which layer you’re transacting in — and what the data does and doesn’t tell you — is critical to making accurate valuations.
Stage 1: Used Wholesale — The Fleet Liquidation Layer
Used wholesale represents the price a professional remarketing channel will pay to acquire inventory in volume — the lot-acquisition floor of the secondary GPU market. Stage 1 pricing is published exclusively to The GPU Resource members. The methodology applies a 25% discount to the Stage 2 median for high-activity models and a 35% discount for thin-market models, with operator-set wholesale anchors used for select premium-AI segments (H100 variants, A40, A100 80GB SXM4) where peer-to-peer signal alone remains too thin for confident valuation. Specific Stage 1 dollar values are available to subscribers — contact info@gpuresource.com to subscribe.
Stage 2: Private Aftermarket — The ITAD, Broker & Reseller Layer
Stage 2 is the engine of the secondary GPU market — where ITAD companies, specialized brokers, and professional resellers trade with each other and with sophisticated buyers. Our proprietary survey captures this layer directly. The private aftermarket is the most informationally dense layer and the closest proxy to true market price.
Stage 3: Public Used Values — What End Buyers Pay
The public used market — where individual sellers list single units to end buyers — typically commands 15–40% above the private aftermarket median. This premium reflects verification, warranty assurance, buyer protections, and single-unit convenience.
Three-Stage Pricing Table — May 11, 2026
| GPU Model | Stage 1: Used Wholesale | Stage 2: Private Aftermarket | Stage 3: Public Used Market |
|---|---|---|---|
| NVIDIA H100 NVL 94GB | 🔒 Subscribers Only | $27,614 – $43,522 | $33,016 – $42,021 |
| NVIDIA H100 PCIe 80GB | 🔒 Subscribers Only | $23,805 – $37,519 | $28,462 – $36,225 |
| NVIDIA H100 SXM5 80GB | 🔒 Subscribers Only | $9,522 – $15,008 | $11,385 – $14,490 |
| NVIDIA A100 80GB SXM4 | 🔒 Subscribers Only | $4,761 – $7,504 | $5,692 – $7,245 |
| NVIDIA A100 80GB PCIe | 🔒 Subscribers Only | $3,570 – $5,670 | $4,830 – $5,880 |
| NVIDIA A100 40GB SXM4 | 🔒 Subscribers Only | $3,555 – $5,646 | $4,810 – $5,855 |
| NVIDIA A100 40GB PCIe | 🔒 Subscribers Only | $3,451 – $5,481 | $4,669 – $5,684 |
| NVIDIA RTX A6000 | 🔒 Subscribers Only | $3,424 – $5,439 | $4,633 – $5,640 |
| NVIDIA A40 | 🔒 Subscribers Only | $2,619 – $4,127 | $3,131 – $3,985 |
| NVIDIA RTX A5000 | 🔒 Subscribers Only | $1,526 – $2,423 | $2,064 – $2,513 |
| NVIDIA RTX 4090 | 🔒 Subscribers Only | $1,095 – $1,739 | $1,481 – $1,803 |
| NVIDIA RTX 3090 Ti | 🔒 Subscribers Only | $1,012 – $1,608 | $1,370 – $1,668 |
| NVIDIA RTX 3090 | 🔒 Subscribers Only | $956 – $1,519 | $1,294 – $1,575 |
| NVIDIA V100 | 🔒 Subscribers Only | $236 – $375 | $320 – $389 |
| NVIDIA Tesla P100 | 🔒 Subscribers Only | $72.25 – $115 | $97.75 – $119 |
Stage 1 (Used Wholesale) pricing is member-only. Stage 2 and Stage 3 bands shown above. Premium-AI segments (H100 variants, A40, A100 80GB SXM4) reflect operator-set wholesale anchors; all values in USD per unit.
The Stage 1 (Used Wholesale) layer is the most commercially sensitive tier of The GPU Resource Pricing Survey and is published exclusively to subscribers. Contact info@gpuresource.com to subscribe and unlock Stage 1 access for every tracked GPU model, every issue.
Section 4: GPU Market Pulse Score
The Overall GPU Market Pulse Score of 64.3 for the May 11 cycle reflects a market operating in moderate positive territory — above the 50-point neutral threshold that demarcates contracting from stable-to-expanding conditions, but meaningfully below the 70-point level at which consensus bullish framing would be warranted. The score is dragged down by three Distressed or deep-Cautionary names — A100 80GB PCIe (36.3), A40 (31.0), and V100 (45.2) — whose structural derating from Blackwell displacement is now well-established and unlikely to reverse on a short-cycle basis. The RTX 4090’s sharp intra-cycle decline to 46.7 added additional weight to the composite reading, preventing a score improvement from Report #2 despite strong gains across the A100 40GB and H100 families. The strongest-scoring segment this cycle is the A100 40GB PCIe at 81.7, narrowly ahead of the RTX 3090 at 80.5 and the A100 40GB SXM4 at 79.8 — a clustering that confirms 40GB memory-class Ampere datacenter silicon as the current market’s performance anchor. The weakest segment is the A40 at 31.0, followed by the A100 80GB PCIe at 36.3, both of which have now recorded Distressed readings across two consecutive report cycles. For portfolio risk management purposes, the 50.7-point spread between the highest and lowest scores in the tracked universe is the widest observed since this publication’s launch, underscoring the imperative for operators to manage GPU inventory at the individual-SKU level rather than treating ‘datacenter GPU’ as a monolithic asset class.
| GPU Model | Pulse Score | Momentum / Trend |
|---|---|---|
| NVIDIA A100 40GB PCIe | 81.7 — Strong | Rising (+40.7 vs Issue 2) |
| NVIDIA RTX 3090 | 80.5 — Strong | Rising (+9.8 vs Issue 2) |
| NVIDIA A100 40GB SXM4 | 79.8 — Healthy | Rising (+26.4 vs Issue 2) |
| NVIDIA RTX 3090 Ti | 79.7 — Healthy | Rising (+38.3 vs Issue 2) |
| NVIDIA A100 80GB SXM4 | 75.8 — Healthy | Rising (new to scored board) |
| NVIDIA H100 NVL 94GB | 75.6 — Healthy | Rising (+23.2 vs Issue 2) |
| NVIDIA H100 PCIe 80GB | 75.1 — Healthy | Rising (+1.7 vs Issue 2) |
| NVIDIA H100 SXM5 80GB | 75.1 — Healthy | Rising (−9.6 vs Issue 2) |
| NVIDIA RTX A5000 | 67.7 — Healthy | Rising (+6.9 vs Issue 2) |
| NVIDIA Tesla P100 | 59.2 — Cautionary | Declining (+43.8 vs Issue 2) |
| NVIDIA RTX A6000 | 55.3 — Cautionary | Stable (−3.9 vs Issue 2) |
| NVIDIA RTX 4090 | 46.7 — Cautionary | Declining (−50.3 vs Issue 2) |
| NVIDIA V100 | 45.2 — Cautionary | Declining (+9.3 vs Issue 2) |
| NVIDIA A100 80GB PCIe | 36.3 — Distressed | Declining (−3.6 vs Issue 2) |
| NVIDIA A40 | 31.0 — Distressed | Declining (−10.3 vs Issue 2) |
Scoring Tier Reference
| Score Range | Rating | Interpretation |
|---|---|---|
| 80–100 | Strong — Seller’s Market | Rising or stable prices, high demand — optimal conditions to transact |
| 60–79 | Healthy — Balanced Conditions | Solid demand, prices largely holding — favorable but monitor cycle to cycle |
| 40–59 | Cautionary — Transition Market | Broad price pressure underway — timing matters on declining models |
| < 40 | Distressed — Buyer’s Market | Widespread depreciation, low demand — sell now or accept continued erosion |
The interactive GPU Market Pulse Score tool includes individual model score breakdowns, three-factor detail panels, methodology documentation, and the complete scored ranking across all 15 models. Visit gpuresource.com to access the full interactive analysis.
Conclusion & Market Outlook
The May 11 cycle crystallizes a market structure that has been building since Report #2: the secondary GPU market is no longer moving directionally as a category but as a collection of independent supply-demand micro-markets with diverging fundamentals. The A100 40GB re-acceleration — driven by inference workload demand and Blackwell supply constraints — coexists in the same market with the RTX 4090 scarcity premium’s complete unwinding and the continued structural deterioration of A40 and A100 80GB PCIe inventory values. ITAD operators and resellers who modeled portfolio performance on prior-cycle assumptions should treat the 64.3 Pulse Score as a prompt for position-level review rather than a directional macro signal.
Looking into the next two-week window, the principal variables to watch are Blackwell allocation announcements — any material loosening of H100 and H200 supply constraints would have immediate and negative implications for A100 40GB repricing momentum — and continued channel absorption data for RTX 3090/3090 Ti inventory, which has quietly become one of the more liquid and directionally consistent segments in the current survey universe. The H100 SXM5 Pulse compression observed this cycle warrants close attention; if transaction cadence does not recover, the score trajectory could turn decisively negative in the May 25 issue. A40 and A100 80GB PCIe holders face the most time-sensitive decisions: current floor pricing offers limited additional downside protection, and holding costs are accruing against a backdrop of no credible demand recovery catalyst on the near-term horizon.
The GPU Resource Pricing Survey will continue to monitor all fifteen tracked SKUs plus any editorial additions through the bi-weekly publication cadence. Institutional subscribers are encouraged to cross-reference Stage 2 median ranges with their specific channel positioning — wholesale-to-aftermarket spread dynamics in this cycle diverged meaningfully by segment, and blended portfolio valuations may materially misrepresent realized liquidation outcomes for operators with concentrated exposure to any single tier or use-case category.
GPU Pulse Market Report #4 publishes on or around May 25, 2026, and will expand coverage to include updated Pulse Score tracking across the full fifteen-SKU universe, with particular focus on whether A100 40GB appreciation momentum can be sustained into a second consecutive cycle, RTX 4090 price discovery following this cycle’s scarcity premium collapse, and any emerging signals from the H100 SXM5 thin-market dynamic flagged in this issue. The GPU Resource Pricing Survey corpus will be refreshed in full for the new cycle.
Data Methodology & Sources
Private Aftermarket Data (Core Survey)
- Source: The GPU Resource Pricing Survey — peer-to-peer aftermarket transactions, 30-day lookback
- Metric: Median price per unit from recent transactions per GPU model
- Condition filter: Used only; tested, functional, Grade A cosmetics
Used Wholesale Estimates (Member Access)
- Stage 1 (Used Wholesale) pricing is published exclusively to The GPU Resource members
- Methodology: Stage 2 median discounted by 25% (high-activity models) or 35% (thin-market models)
- Premium-AI segments use operator-set wholesale anchors (H100 variants, A40, A100 80GB SXM4)
- Criteria: 5–10 unit purchase, tested & functional, Grade A cosmetics, USD per unit
- Subscribe at info@gpuresource.com to unlock Stage 1 across all 15 tracked GPUs
GPU Market Pulse Score
- Composite of three factors: Price momentum/stability (50%), Demand level (40%), Liquidity (10%)
- Bi-weekly cycle; momentum measured against the prior issue’s private aftermarket median
- Full methodology available at gpuresource.com
© 2026 The GPU Resource. All rights reserved. This report is provided for informational purposes only and does not constitute an offer to buy or sell any asset. Values reflect market conditions as of May 11, 2026.