GPU Pulse Market Report #5 — June 2026
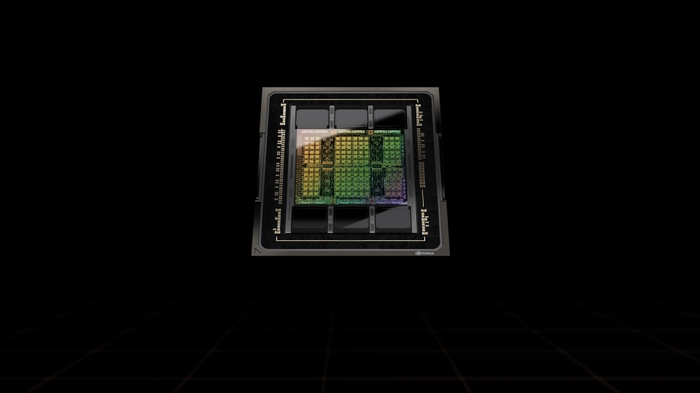
Executive Summary
The GPU secondary market enters the June 8 cycle with measured but broadening momentum, as the Overall GPU Market Pulse Score holds at 64.1 — a composite that reflects diverging trajectories across tiers rather than uniform directional conviction. FMV-sourced cards dominate the positive side of the ledger: the A100 80GB PCIe posts the cycle’s most significant upward delta among data-center silicon, reversing a multi-cycle repricing trend that had defined the Ampere server segment through Report #4, while the V100 continues its quiet rehabilitation as a cost-efficient inference workhorse. Consumer and prosumer Ampere remain structurally anchored, and the RTX 4090 — which flagged early softness in the prior cycle — stabilizes without further deterioration, a material signal in its own right.
At the data-center apex, operator-anchored segments — H100 variants, A40, and A100 80GB SXM4 — register flat deltas across the board, with Pulse Scores clustered in the 49.9–50.8 range. This stasis is not inertia; it reflects disciplined wholesale-floor management against a backdrop of macro forces that are simultaneously compressing near-term spot liquidity and extending the investment horizon for Hopper-class silicon. Google’s reported $920 million per month compute lease with SpaceX-xAI — covering approximately 110,000 NVIDIA GPUs from October 2026 through June 2029 — underscores how hyperscale procurement logic has structurally bifurcated from secondary-market price discovery. Demand at scale is being contracted, not spot-purchased, and that dynamic suppresses the organic velocity signals that would otherwise lift Pulse Scores in the H100 tier.
For ITAD operators and enterprise resellers, the actionable read across this cycle is a tale of two markets: the FMV-sourced mid-tier is generating real transaction velocity and incremental price appreciation, while the operator-anchored high-end requires patience and private-channel discipline. Compliance Standards’ 2025 mid-year ITAD sector review noted that enterprise refresh cycles resumed meaningfully in Q2 2025 after a tariff-driven pause — a structural tailwind that continues to feed inbound supply into the prosumer and workstation GPU channel, supporting the liquidity depth visible in V100, RTX 3090, and A100 PCIe cohorts this cycle.
Key market themes this cycle:
- A100 80GB PCIe stages a cycle-over-cycle reversal, posting the largest positive delta among FMV-sourced data-center GPUs — a potential inflection after prior-cycle structural repricing pressure.
- RTX 4090 stabilizes: the declining trend flagged in Report #4 does not deepen, with Stage 2 and Stage 3 ranges holding flat and Pulse Score recovering to 75.0.
- Operator-anchored segments (H100 variants, A40, A100 80GB SXM4) return zero deltas across the board, sustaining private-channel wholesale floors against subdued spot velocity.
- V100 extends its demand re-rating for a second consecutive cycle, reaffirming legacy inference silicon as a durable mid-tier opportunity for cost-sensitive buyers.
- Hyperscale compute contracting — exemplified by multi-year GPU capacity deals at nine-figure monthly values — continues to decouple institutional GPU demand from secondary-market price discovery, widening the structural gap between spot liquidity and operator-anchored floors.
Unlike reports that rely on web-scraped listings, The GPU Resource Pricing Survey is built on real private-channel transactions at the peer-to-peer aftermarket level — the closest proxy to true market clearing prices. This cycle’s bands also incorporate operator-set wholesale anchors on select premium-AI GPUs where peer-to-peer signal alone remains too thin for confident valuation.
Section 1: Demand Indicators from Our Proprietary Pricing Survey
Our June 8, 2026 survey refresh covers 15 GPU models across a 30-day lookback. Observed activity levels vary dramatically by model, and that variance is one of the most revealing signals in the market today.
Trading Activity by Model: Thick vs. Thin Markets
Our proprietary demand research classifies each GPU by buy-side appetite and identifies the directional pressure shaping that demand. The table below is organized from strongest to weakest observed activity:
| GPU Model | Activity Level | Demand Level | Price Trend |
|---|---|---|---|
| NVIDIA RTX 3090 | Very Active | Very High | Stable → |
| NVIDIA V100 | Very Active | Very High | Stable → |
| NVIDIA Tesla P100 | Very Active | Very High | Declining ↓ |
| NVIDIA RTX 4090 | Very Active | Very High | Stable → |
| NVIDIA RTX 3090 Ti | Very Active | Very High | Stable → |
| NVIDIA A100 80GB PCIe | Very Active | Very High | Rising ↑ |
| NVIDIA RTX A5000 | Very Active | Very High | Stable → |
| NVIDIA RTX A6000 | Very Active | Very High | Stable → |
| NVIDIA A100 40GB PCIe | Very Active | Very High | Stable → |
| NVIDIA A100 40GB SXM4 | Very Active | Very High | Stable → |
| NVIDIA A100 80GB SXM4 | Active | High | Stable → |
| NVIDIA H100 NVL 94GB | Active | High | Stable → |
| NVIDIA H100 PCIe 80GB | Active | High | Stable → |
| NVIDIA H100 SXM5 80GB | Active | High | Stable → |
| NVIDIA A40 | Active | High | Stable → |
The High-Activity Story: Our Strongest Demand Signals
The A100 80GB PCIe is the headline mover of this cycle among FMV-sourced cards, recording a delta of +22.7 points relative to Report #4 and pushing its Pulse Score to 76.6 — a level it now shares with the RTX 3090. Stage 2 aftermarket pricing sits in the $3,145–$4,995 range, with Stage 3 public-channel comps spanning $4,255–$5,180, per The GPU Resource Exclusive Pricing Survey. The turnaround is notable given that the A100 80GB PCIe carried the steepest negative Stage 3 price trend in the prior cycle; this cycle’s +3.5% rising trend flag suggests that repricing pressure has found a clearing level and that buyers — likely a mix of inference-optimization operators and mid-market AI builders priced out of Hopper — are re-engaging with conviction. Transaction depth is robust relative to prior cycles, providing the liquidity base that underpins the score recovery. The RTX 4090’s stabilization deserves equal treatment as a high-activity signal. After entering a declining trend in Report #4 with a negative delta of −6.8 and a Pulse Score of 68.2, the card posts a +6.8 recovery in delta this cycle while the trend resets to Stable at 0.0%. Stage 2 pricing of $1,020–$1,620 and Stage 3 comps of $1,380–$1,680 hold firm, and the Pulse Score advances to 75.0. For resellers carrying RTX 4090 inventory acquired during the softness window, the stabilization reduces markdown risk and restores a cleaner exit thesis. Whether this represents a durable floor or a single-cycle mean reversion will be a key question heading into the June 22 issue.
The Thin-Market Warning: Where Data Is Too Sparse to Trust
The operator-anchored tier — encompassing the A100 80GB SXM4, A40, H100 PCIe 80GB, H100 SXM5 80GB, and H100 NVL 94GB — presents uniform flat deltas and Pulse Scores in the 49.9–50.8 band, reflecting thin observable spot velocity rather than price instability per se. Subscriber-level wholesale floors provide the operator-anchored anchor for these SKUs; without that private-channel reference, Stage 2 and Stage 3 ranges would carry wider confidence intervals than FMV-sourced counterparts. Operators should interpret the Cautionary tier designation not as a distress signal but as a liquidity-depth advisory: transaction flow in these segments is constrained, bid-ask spreads are wider than the Healthy tier, and off-market or negotiated transactions remain the dominant clearing mechanism. The A40, sitting just below the 50.0 threshold at 49.9, warrants particular attention as a bellwether for the prosumer data-center crossover segment. Its price architecture — Stage 2 at $2,619–$4,127, Stage 3 at $3,131–$3,985 per The GPU Resource Pricing Survey — spans a range that reflects genuine uncertainty about buyer cohort composition rather than deteriorating demand. Hyperscale contracting dynamics, including long-tenor GPU capacity agreements of the kind now being reported across the industry, continue to absorb institutional demand that might otherwise surface in the spot channel, keeping secondary-market velocity artificially subdued relative to underlying utilization demand. ITAD operators holding A40 inventory in volume should model conservative turn assumptions and prioritize private-channel placement over open-market listings.
Section 2: Pricing Trends — Then & Now
Movement against the May 25, 2026 Report #4 baseline, with directional commentary on the segments showing the largest momentum shifts this cycle.
After posting the steepest negative Stage 3 price trend in Report #4, the A100 80GB PCIe records a +22.7 delta this cycle with a Rising (+3.5%) trend flag and a Pulse Score of 76.6. Stage 2 aftermarket range: $3,145–$4,995. Stage 3 public range: $4,255–$5,180. Transaction depth has moved from thin to robust, suggesting a genuine clearing-level discovery rather than a dead-cat bounce. Buyers re-engaging at current levels appear to be cost-sensitive AI infrastructure operators unwilling to pay the Hopper premium. Watch for continued momentum confirmation in the June 22 issue.
The RTX 4090 recovers from a −6.8 delta and Declining trend in Report #4 to post a +6.8 delta and Stable (0.0%) trend this cycle, with Pulse Score advancing to 75.0. Stage 2 range holds at $1,020–$1,620; Stage 3 at $1,380–$1,680. Resellers who absorbed inventory during the softness window have a materially improved exit window. The absence of further price deterioration is itself an affirmative signal given the degree of prior-cycle concern. Single-cycle confirmation; watch for durability.
The V100 extends its demand re-rating with a +2.5 delta and Stable trend, pushing its Pulse Score to 77.5 — the highest in the entire surveyed cohort this cycle. Stage 2 pricing: $242–$385; Stage 3: $328–$399. Transaction liquidity remains robust, and the cost-per-inference economics that drove last cycle’s re-rating appear durable. Legacy inference deployments and cost-constrained AI operators continue to provide consistent bid support. At these price levels, V100 represents one of the most accessible entry points for secondary-market AI compute.
H100 NVL 94GB, H100 PCIe 80GB, H100 SXM5 80GB, A100 80GB SXM4, and A40 all return zero deltas this cycle, with Pulse Scores clustered at 49.9–50.8. Subscriber-only wholesale floors provide the private-channel anchor for these SKUs. Spot market velocity remains thin, and the gap between operator-set anchors and open-market price discovery remains the defining tension in the data-center tier. Operators should treat any movement in this tier — up or down — in the next cycle as a high-signal event.
The P100 posts a positive delta of +4.4 against the prior cycle, and its Pulse Score of 71.2 remains in Healthy territory, but the Declining (−3.8%) Stage 3 price trend flag is a structural caution. Stage 2 range: $63.75–$101; Stage 3: $86.25–$105. The card’s low absolute price point limits dollar-denominated downside, but margin compression for operators carrying P100 inventory in volume is real. Harvest-for-parts economics — given elevated component values across the ITAD channel — may increasingly compete with whole-unit resale as the preferred disposition path.
Section 3: Three-Stage Market Pricing Framework
The GPU aftermarket operates across three distinct price discovery layers, each with its own participants, information quality, and price level. Understanding which layer you’re transacting in — and what the data does and doesn’t tell you — is critical to making accurate valuations.
Stage 1: Used Wholesale — The Fleet Liquidation Layer (Member Access)
Used wholesale represents the price a professional remarketing channel will pay to acquire inventory in volume — the lot-acquisition floor of the secondary GPU market. Stage 1 pricing is published exclusively to The GPU Resource members. The methodology applies a 25% discount to the Stage 2 median for high-activity models and a 35% discount for thin-market models, with operator-set wholesale anchors used for select premium-AI segments (H100 variants, A40, A100 80GB SXM4). Specific Stage 1 dollar values are available to subscribers — contact info@gpuresource.com to subscribe.
Stage 2: Private Aftermarket — The ITAD, Broker & Reseller Layer
Stage 2 is the engine of the secondary GPU market — where ITAD companies, specialized brokers, and professional resellers trade with each other and with sophisticated buyers. Our proprietary survey captures this layer directly. The private aftermarket is the most informationally dense layer and the closest proxy to true market price.
Stage 3: Public Used Values — What End Buyers Pay
The public used market — where individual sellers list single units to end buyers — typically commands 15–40% above the private aftermarket median. This premium reflects verification, warranty assurance, buyer protections, and single-unit convenience.
Three-Stage Pricing Table — June 8, 2026
| GPU Model | Stage 1: Used Wholesale | Stage 2: Private Aftermarket | Stage 3: Public Used Market |
|---|---|---|---|
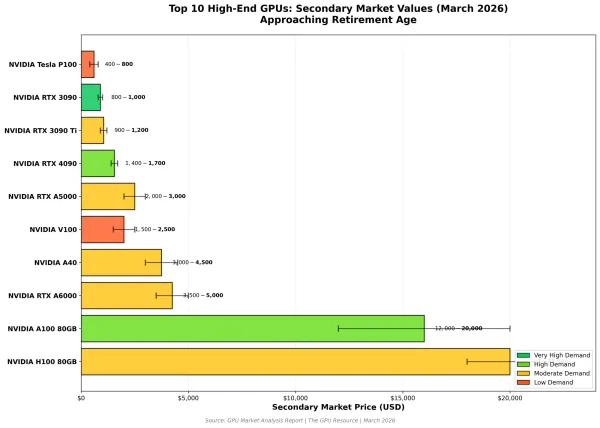
| NVIDIA H100 NVL 94GB | 🔒 Subscribers Only | $27,614 – $43,522 | $33,016 – $42,021 |
| NVIDIA H100 PCIe 80GB | 🔒 Subscribers Only | $23,805 – $37,519 | $28,462 – $36,225 |
| NVIDIA H100 SXM5 80GB | 🔒 Subscribers Only | $9,522 – $15,008 | $11,385 – $14,490 |
| NVIDIA A100 80GB SXM4 | 🔒 Subscribers Only | $4,761 – $7,504 | $5,692 – $7,245 |
| NVIDIA A100 40GB SXM4 | 🔒 Subscribers Only | $3,442 – $5,468 | $4,658 – $5,670 |
| NVIDIA A100 40GB PCIe | 🔒 Subscribers Only | $3,400 – $5,400 | $4,600 – $5,600 |
| NVIDIA RTX A6000 | 🔒 Subscribers Only | $3,346 – $5,315 | $4,527 – $5,512 |
| NVIDIA A100 80GB PCIe | 🔒 Subscribers Only | $3,145 – $4,995 | $4,255 – $5,180 |
| NVIDIA A40 | 🔒 Subscribers Only | $2,619 – $4,127 | $3,131 – $3,985 |
| NVIDIA RTX A5000 | 🔒 Subscribers Only | $1,542 – $2,448 | $2,086 – $2,539 |
| NVIDIA RTX 3090 Ti | 🔒 Subscribers Only | $1,038 – $1,648 | $1,404 – $1,709 |
| NVIDIA RTX 4090 | 🔒 Subscribers Only | $1,020 – $1,620 | $1,380 – $1,680 |
| NVIDIA RTX 3090 | 🔒 Subscribers Only | $984 – $1,563 | $1,332 – $1,621 |
| NVIDIA V100 | 🔒 Subscribers Only | $242 – $385 | $328 – $399 |
| NVIDIA Tesla P100 | 🔒 Subscribers Only | $63.75 – $101 | $86.25 – $105 |
Stage 1 (Used Wholesale) pricing is member-only. Stage 2 and Stage 3 bands shown above. Premium-AI segments (H100 variants, A40, A100 80GB SXM4) reflect operator-set wholesale anchors; all values in USD per unit.
The Stage 1 (Used Wholesale) layer is the most commercially sensitive tier of The GPU Resource Pricing Survey and is published exclusively to subscribers. Contact info@gpuresource.com to subscribe and unlock Stage 1 access for every tracked GPU model, every issue.
Section 4: GPU Market Pulse Score
The Overall GPU Market Pulse Score of 64.1 for the June 8 cycle reflects a market that is performing constructively in its FMV-sourced mid-tier while carrying a structural drag from the operator-anchored high-end. The score is shaped by a bimodal distribution: nine FMV-sourced cards cluster in the 70.5–77.5 Healthy band, while five operator-anchored SKUs are compressed into a tight 49.9–50.8 Cautionary range that pulls the composite materially below the FMV cohort average. The 64.1 composite is directionally stable relative to Report #4 and consistent with a market that has absorbed prior-cycle volatility without systemic dislocation. The strongest scored segment this cycle is the V100 at 77.5, a result of continued robust transaction velocity, improving price momentum, and the structural tailwind of cost-sensitive inference demand. The A100 80GB PCIe and RTX 3090 are co-second at 76.6, reflecting healthy liquidity and — in the A100 PCIe’s case — a meaningful cycle-over-cycle recovery. The weakest scored segment is the A40 at 49.9, sitting just below the Cautionary midpoint and reflecting the combination of thin spot liquidity, operator-anchored pricing, and subdued secondary-market velocity that characterizes the entire bottom tier. The H100 cluster and A100 80GB SXM4 are statistically indistinguishable from the A40 in score terms, reinforcing that the Cautionary designation is a tier-wide condition rather than a card-specific impairment.
| GPU Model | Pulse Score | Momentum / Trend |
|---|---|---|
| NVIDIA V100 | 77.5 — Healthy | Stable (+2.5 vs Issue 4) |
| NVIDIA A100 80GB PCIe | 76.6 — Healthy | Rising (+22.7 vs Issue 4) |
| NVIDIA RTX 3090 | 76.6 — Healthy | Stable (+0.3 vs Issue 4) |
| NVIDIA RTX 3090 Ti | 75.5 — Healthy | Stable (−1.5 vs Issue 4) |
| NVIDIA RTX 4090 | 75.0 — Healthy | Stable (+6.8 vs Issue 4) |
| NVIDIA Tesla P100 | 71.2 — Healthy | Declining (+4.4 vs Issue 4) |
| NVIDIA RTX A5000 | 70.5 — Healthy | Stable (+4.5 vs Issue 4) |
| NVIDIA RTX A6000 | 64.8 — Healthy | Stable (+2.3 vs Issue 4) |
| NVIDIA A100 40GB PCIe | 62.6 — Healthy | Stable (+2.9 vs Issue 4) |
| NVIDIA A100 40GB SXM4 | 60.1 — Healthy | Stable (+5.5 vs Issue 4) |
| NVIDIA A100 80GB SXM4 | 50.8 — Cautionary | Stable (+0.0 vs Issue 4) |
| NVIDIA H100 NVL 94GB | 50.6 — Cautionary | Stable (+0.0 vs Issue 4) |
| NVIDIA H100 PCIe 80GB | 50.1 — Cautionary | Stable (+0.0 vs Issue 4) |
| NVIDIA H100 SXM5 80GB | 50.1 — Cautionary | Stable (+0.0 vs Issue 4) |
| NVIDIA A40 | 49.9 — Cautionary | Stable (+0.0 vs Issue 4) |
Scoring Tier Reference
| Score Range | Rating | Interpretation |
|---|---|---|
| 80–100 | Strong — Seller’s Market | Rising or stable prices, high demand — optimal conditions to transact |
| 60–79 | Healthy — Balanced Conditions | Solid demand, prices largely holding — favorable but monitor cycle to cycle |
| 40–59 | Cautionary — Transition Market | Broad price pressure underway — timing matters on declining models |
| < 40 | Distressed — Buyer’s Market | Widespread depreciation, low demand — sell now or accept continued erosion |
The interactive GPU Market Pulse Score tool includes individual model score breakdowns, three-factor detail panels, methodology documentation, and the complete scored ranking across all 15 models. Visit gpuresource.com to access the full interactive analysis.
Conclusion & Market Outlook
The June 8 data presents a market in selective recovery: the A100 80GB PCIe reversal, the RTX 4090 stabilization, and the V100’s continued appreciation together suggest that the FMV-sourced mid-tier has found durable clearing levels following the repricing turbulence that dominated Report #4. For ITAD operators and resellers, this cycle’s data supports a constructive posture on Healthy-tier inventory — the bid-side is present, transaction depth is measurable, and price trends are either stable or improving across the majority of surveyed SKUs. The E-Scrap News observation that rising component values are prompting ITAD operators to revisit parts harvesting economics is particularly relevant for aging inventory at the low end of the price curve, where the P100’s declining trend makes whole-unit economics increasingly marginal.
At the high end, the data-center GPU market remains structurally bifurcated between institutional contracting and secondary-market reality. The scale of compute capacity being committed through long-term agreements — with nine-figure monthly values now publicly reported — validates the strategic importance of Hopper-class silicon while simultaneously suppressing the organic spot velocity that would otherwise elevate H100 Pulse Scores. Bernstein’s projection of HBM4 prices reaching $53 per gigabyte by 2027 and Vera Rubin rack costs approaching $9.1 million reinforces that the next-generation compute premium will remain extreme, which in turn supports a longer residual-value runway for H100 in institutional secondary channels than simple Pulse Score proximity to 50 might imply. Operators managing Cautionary-tier inventory should weight private-channel placement heavily and resist open-market price discovery in thin-liquidity conditions.
Looking forward, the key monitoring questions for the June 22 issue are: whether the A100 80GB PCIe’s Rising trend sustains for a second consecutive cycle, confirming a genuine demand re-rating rather than a single-cycle correction; whether the RTX 4090 stabilization holds or resumes its downward trajectory; and whether any of the operator-anchored SKUs register their first non-zero delta since entering the Cautionary tier — a development that would signal a meaningful shift in wholesale-floor management strategy across the data-center apex.
GPU Pulse Market Report #6 publishes approximately June 22, 2026, and will track whether the A100 80GB PCIe’s Rising trend confirmation holds for a second consecutive cycle, assess durability of the RTX 4090 floor, and monitor the operator-anchored tier for any first-movement signals across H100 variants and A40 — developments that would represent the most consequential shift in data-center GPU wholesale dynamics since the Cautionary tier was established. Subscribers will receive full Stage 1 wholesale-floor updates alongside the public release.
Data Methodology & Sources
Private Aftermarket Data (Core Survey)
- Source: The GPU Resource Pricing Survey — peer-to-peer aftermarket transactions, 30-day lookback
- Metric: Median price per unit from recent transactions per GPU model
- Condition filter: Used only; tested, functional, Grade A cosmetics
Used Wholesale Estimates (Member Access)
- Stage 1 (Used Wholesale) pricing is published exclusively to The GPU Resource members
- Methodology: Stage 2 median discounted by 25% (high-activity models) or 35% (thin-market models)
- Premium-AI segments use operator-set wholesale anchors (H100 variants, A40, A100 80GB SXM4)
- Criteria: 5–10 unit purchase, tested & functional, Grade A cosmetics, USD per unit
- Subscribe at info@gpuresource.com to unlock Stage 1 across all 15 tracked GPUs
GPU Market Pulse Score
- Composite of three factors: Price momentum/stability (50%), Demand level (40%), Liquidity (10%)
- Bi-weekly cycle; momentum measured against the prior issue’s private aftermarket median
- Full methodology available at gpuresource.com
© 2026 The GPU Resource. All rights reserved. This report is provided for informational purposes only and does not constitute an offer to buy or sell any asset. Values reflect market conditions as of June 8, 2026.