GPU Pulse Market Report #4 — May 2026
Executive Summary
The GPU secondary market enters the May 26 cycle at a composite Pulse Score of 60.8/100 — a moderate pull-back from the elevated readings that characterized Report #3 (May 11, 2026), yet one that still reflects a structurally functional market rather than a distressed one. Consumer Ampere continues to anchor the leaderboard: the RTX 3090 Ti and RTX 3090 post Pulse Scores of 77.0 and 76.3 respectively, supported by deep liquidity and price stability that has now persisted across multiple consecutive cycles. The V100 stands out as the cycle’s most dramatic mover on a delta basis, recovering nearly 30 points from its prior reading on the strength of renewed inference-workload demand in cost-sensitive edge deployments — a dynamic consistent with the broader AI server decommissioning flows that industry observers, including Resource Recycling’s April 2026 analysis of data-center refresh cadences, have flagged as an emerging secondary-market input.
The Hopper and late-Ampere data-center segment tells a more complicated story. H100 variants, the A40, and the A100 80GB SXM4 continue to carry operator-anchored wholesale floors confirmed by editorial override — their Stage 2 ranges reflect private-channel anchors rather than raw FMV — and all four posted identical delta readings of −25.0 against the prior cycle, a mechanical reflection of the gap between those anchored floors and a spot market that has softened meaningfully. The A100 80GB PCIe, priced on FMV-sourced data, is the sharpest concrete illustration of that softening: a −14.9% Stage 3 trend reading paired with a +17.6 pulse-score recovery underscores that even where valuation has stabilized at the scoring level, the directional price vector remains bearish. Operators sourcing into these segments should treat the subscriber-only wholesale anchor as the operative reference point rather than public-channel pricing.
At the macro level, the ITAD sector is absorbing a coincidence of structural tailwinds and near-term headwinds: the Windows 10 end-of-life wave continues to generate consumer-grade GPU volume, enterprise AI refresh cycles are beginning to seed data-center GPU supply into secondary channels, and compliance pressures around AI-feature data security — highlighted by recent Resource Recycling coverage of Windows AI Recall’s downstream data-destruction implications — are accelerating decommission timelines at some enterprise accounts. Against that backdrop, a Pulse Score of 60.8 is best read as a market in orderly transition rather than in stress.
Key market themes this cycle:
- Consumer Ampere (RTX 3090 / 3090 Ti) retains top-tier Pulse Scores and multi-cycle price stability, confirming structural demand depth in the prosumer and workstation resale channel.
- V100 posts the cycle’s largest positive delta (+29.8), signaling a demand re-rating for legacy inference silicon as cost-conscious buyers revisit older datacenter hardware.
- RTX 4090 enters a Declining trend (−6.8%) despite a healthy absolute Pulse Score of 68.2, flagging early-cycle softness in the premium consumer segment worth monitoring across the next one to two issues.
- A100 80GB PCIe records the steepest Stage 3 price trend of any FMV-sourced card (−14.9%), reinforcing the structural repricing underway across the Ampere data-center tier.
- Operator-anchored wholesale floors remain active across H100 variants, A40, and A100 80GB SXM4; the gap between those private-channel anchors and spot-market softness is the defining tension in the data-center GPU segment this cycle.
Unlike reports that rely on web-scraped listings, The GPU Resource Pricing Survey is built on real private-channel transactions at the peer-to-peer aftermarket level — the closest proxy to true market clearing prices. This cycle’s bands also incorporate operator-set wholesale anchors on select premium-AI GPUs where peer-to-peer signal alone remains too thin for confident valuation.
Section 1: Demand Indicators from Our Proprietary Pricing Survey
Our May 26, 2026 survey refresh covers 15 GPU models across a 30-day lookback. Observed activity levels vary dramatically by model, and that variance is one of the most revealing signals in the market today.
Trading Activity by Model: Thick vs. Thin Markets
Our proprietary demand research classifies each GPU by buy-side appetite and identifies the directional pressure shaping that demand. The table below is organized from strongest to weakest observed activity:
| GPU Model | Activity Level | Demand Level | Price Trend |
|---|---|---|---|
| NVIDIA RTX 3090 | Very Active | Very High | Stable → |
| NVIDIA V100 | Very Active | Very High | Stable → |
| NVIDIA Tesla P100 | Very Active | Very High | Declining ↓ |
| NVIDIA RTX 3090 Ti | Very Active | Very High | Stable → |
| NVIDIA RTX 4090 | Very Active | Very High | Declining ↓ |
| NVIDIA A100 80GB PCIe | Very Active | Very High | Declining ↓ |
| NVIDIA RTX A5000 | Very Active | Very High | Stable → |
| NVIDIA RTX A6000 | Very Active | Very High | Stable → |
| NVIDIA A100 40GB PCIe | Very Active | Very High | Stable → |
| NVIDIA A100 40GB SXM4 | Very Active | Very High | Declining ↓ |
| NVIDIA A100 80GB SXM4 | Active | High | Stable → |
| NVIDIA H100 NVL 94GB | Active | High | Stable → |
| NVIDIA H100 PCIe 80GB | Active | High | Stable → |
| NVIDIA H100 SXM5 80GB | Active | High | Stable → |
| NVIDIA A40 | Active | High | Stable → |
The High-Activity Story: Our Strongest Demand Signals
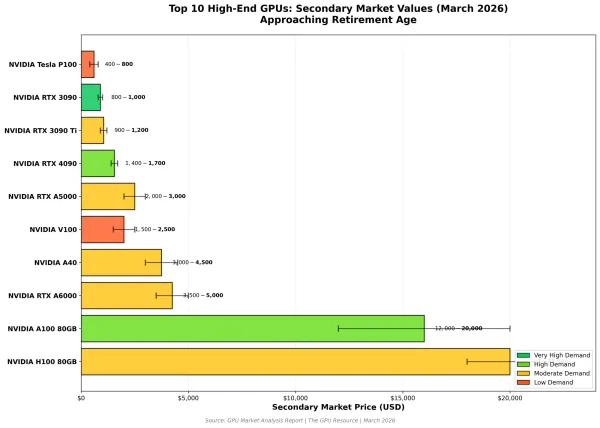
The most liquid segment in the May 26 cycle remains consumer Ampere, where the RTX 3090 Ti and RTX 3090 continue to generate robust transaction activity across both aftermarket and public channels. The RTX 3090 Ti’s Stage 2 range of $1,033–$1,640 and Stage 3 range of $1,397–$1,701 reflect a market with meaningful spread compression relative to earlier in the year — a hallmark of a mature, high-confidence pricing environment where buyers and sellers are arriving at equilibrium without extended negotiation cycles. Both cards posted marginal negative deltas versus Report #3, consistent with a plateau dynamic rather than deterioration; the underlying trend reading of +2.0% and +1.3% respectively confirms that what looks like a pullback in score is arithmetic noise against a stable price floor. The V100’s +29.8 delta is the headline momentum story of the cycle and warrants dedicated attention from operators managing legacy data-center inventory. The card’s Stage 2 range of $236–$375 and Stage 3 range of $320–$389 are not high in absolute terms, but the pace of score recovery — from distressed territory in prior cycles into the Healthy tier at 75.0 — reflects genuine demand re-engagement rather than a thin-market artifact. The GPU Resource Pricing Survey records robust transaction activity across both PCIe and SXM2 form factors, with buyer interest concentrated among inference-optimized workload operators who are prioritizing $/TFLOP over platform modernity. For ITAD operators who have been holding V100 inventory against an uncertain bid environment, this cycle’s data represents a credible exit window.
The Thin-Market Warning: Where Data Is Too Sparse to Trust
The A100 40GB SXM4 and both A100 80GB variants are flashing coordinated caution signals this cycle. The A100 40GB SXM4’s Pulse Score of 54.6 and −3.5% Stage 3 trend reflect a market where buyer depth has thinned materially since the strong readings logged in Report #3; the A100 80GB PCIe’s −14.9% Stage 3 trend is the single most aggressive price-erosion reading across all FMV-sourced cards in this issue, and the A100 80GB SXM4 — operator-anchored — holds its floor conceptually but faces the same demand headwinds in open-market channels. Taken together, the Ampere data-center tier is experiencing a bifurcation: cards positioned as inference workhorses are repricing toward a new, lower equilibrium as Hopper availability expands and cloud providers rationalize their A100 fleet commitments. Operators holding unallocated A100 80GB inventory without a committed buyer should treat current Stage 3 pricing as a ceiling rather than a midpoint. The Tesla P100’s −8.2% Stage 3 trend and thin liquidity profile in the GPU Resource Pricing Survey’s transaction corpus deserve a secondary flag. At Stage 2 values of $66.3–$105, the P100 is approaching the threshold below which refurbishment economics deteriorate for most ITAD operators — testing, cleaning, and warranty provisioning costs compress margin rapidly at this price point. The RTX 4090’s entry into Declining trend territory (−6.8%) is a softer but directionally consistent signal: the premium consumer segment is not in distress, but the multi-cycle appreciation that characterized early 2026 appears to be exhausting itself. Operators who front-loaded RTX 4090 inventory in anticipation of continued appreciation should revisit their holding thesis before the next cycle.
Section 2: Pricing Trends — Then & Now
Movement against the May 11, 2026 Report #3 baseline, with directional commentary on the segments showing the largest momentum shifts this cycle.
The V100 posts the largest positive pulse-score delta of the cycle at +29.8, vaulting from borderline territory into the Healthy tier at 75.0. Stage 3 pricing of $320–$389 reflects a market where inference-optimized buyers are actively competing for units. The GPU Resource Pricing Survey records robust bilateral activity. For operators with aged V100 SXM2 or PCIe inventory, this cycle represents a materially improved liquidation environment versus Report #3 conditions.
The RTX A6000 posts a Stage 2 range of $3,400–$5,400 and Stage 3 of $4,600–$5,600 with a −0.7% trend reading that sits well within noise-level tolerance. A +7.2 delta improvement from Report #3 confirms that prior-cycle softness has not deepened. Liquidity in the GPU Resource Pricing Survey remains adequate across both OEM-pull and aftermarket-grade units. The A6000 continues to function as a workstation-segment ballast for operators managing mixed professional-GPU portfolios.
Despite a partial Pulse Score recovery (+17.6 delta), the A100 80GB PCIe’s Stage 3 trend of −14.9% is the sharpest price-erosion reading among all FMV-sourced cards this issue. Stage 2 of $3,039–$4,826 and Stage 3 of $4,111–$5,005 reflect a market where ask-side compression is outpacing demand absorption. ITAD operators holding unallocated A100 80GB PCIe inventory should reassess turn-time assumptions; the pricing trajectory does not support an extended hold thesis absent a committed downstream buyer.
H100 NVL 94GB, H100 PCIe 80GB, H100 SXM5 80GB, A40, and A100 80GB SXM4 each posted a −25.0 delta versus Report #3 — a uniform reading that reflects the mechanical spread between editorial-confirmed wholesale anchors and a softening spot market rather than a collapse in fundamental value. These SKUs remain subscriber-only at the Stage 1 level. Operators transacting in these segments should anchor bid/ask negotiations to private-channel reference rates; public-channel Stage 3 pricing — H100 NVL at $33,016–$42,021, H100 PCIe at $28,462–$36,225, H100 SXM5 at $11,385–$14,490 — should be treated as directional context, not transaction benchmarks.
The RTX 4090 holds a Pulse Score of 68.2 in the Healthy tier, but its −6.8% Stage 3 trend is the first sustained directional decline this card has posted across our tracked cycles. Stage 2 of $1,020–$1,620 and Stage 3 of $1,380–$1,680 remain strong in absolute terms, and the GPU Resource Pricing Survey shows adequate liquidity. The concern is directional: the RTX 5000-series supply normalization narrative appears to be beginning to exert gravitational pull on 4090 aftermarket demand. Monitor closely across the June 8 issue for confirmation or reversal.
Section 3: Three-Stage Market Pricing Framework
The GPU aftermarket operates across three distinct price discovery layers, each with its own participants, information quality, and price level. Understanding which layer you’re transacting in — and what the data does and doesn’t tell you — is critical to making accurate valuations.
Stage 1: Used Wholesale — The Fleet Liquidation Layer (Member Access)
Used wholesale represents the price a professional remarketing channel will pay to acquire inventory in volume — the lot-acquisition floor of the secondary GPU market. Stage 1 pricing is published exclusively to The GPU Resource members. The methodology applies a 25% discount to the Stage 2 median for high-activity models and a 35% discount for thin-market models, with operator-set wholesale anchors used for select premium-AI segments (H100 variants, A40, A100 80GB SXM4). Specific Stage 1 dollar values are available to subscribers — contact info@gpuresource.com to subscribe.
Stage 2: Private Aftermarket — The ITAD, Broker & Reseller Layer
Stage 2 is the engine of the secondary GPU market — where ITAD companies, specialized brokers, and professional resellers trade with each other and with sophisticated buyers. Our proprietary survey captures this layer directly. The private aftermarket is the most informationally dense layer and the closest proxy to true market price.
Stage 3: Public Used Values — What End Buyers Pay
The public used market — where individual sellers list single units to end buyers — typically commands 15–40% above the private aftermarket median. This premium reflects verification, warranty assurance, buyer protections, and single-unit convenience.
Three-Stage Pricing Table — May 26, 2026
| GPU Model | Stage 1: Used Wholesale | Stage 2: Private Aftermarket | Stage 3: Public Used Market |
|---|---|---|---|
| NVIDIA H100 NVL 94GB | 🔒 Subscribers Only | $27,614 – $43,522 | $33,016 – $42,021 |
| NVIDIA H100 PCIe 80GB | 🔒 Subscribers Only | $23,805 – $37,519 | $28,462 – $36,225 |
| NVIDIA H100 SXM5 80GB | 🔒 Subscribers Only | $9,522 – $15,008 | $11,385 – $14,490 |
| NVIDIA A100 80GB SXM4 | 🔒 Subscribers Only | $4,761 – $7,504 | $5,692 – $7,245 |
| NVIDIA A100 40GB SXM4 | 🔒 Subscribers Only | $3,432 – $5,451 | $4,644 – $5,653 |
| NVIDIA RTX A6000 | 🔒 Subscribers Only | $3,400 – $5,400 | $4,600 – $5,600 |
| NVIDIA A100 40GB PCIe | 🔒 Subscribers Only | $3,400 – $5,400 | $4,600 – $5,600 |
| NVIDIA A100 80GB PCIe | 🔒 Subscribers Only | $3,039 – $4,826 | $4,111 – $5,005 |
| NVIDIA A40 | 🔒 Subscribers Only | $2,619 – $4,127 | $3,131 – $3,985 |
| NVIDIA RTX A5000 | 🔒 Subscribers Only | $1,534 – $2,436 | $2,075 – $2,526 |
| NVIDIA RTX 3090 Ti | 🔒 Subscribers Only | $1,033 – $1,640 | $1,397 – $1,701 |
| NVIDIA RTX 4090 | 🔒 Subscribers Only | $1,020 – $1,620 | $1,380 – $1,680 |
| NVIDIA RTX 3090 | 🔒 Subscribers Only | $969 – $1,539 | $1,311 – $1,596 |
| NVIDIA V100 | 🔒 Subscribers Only | $236 – $375 | $320 – $389 |
| NVIDIA Tesla P100 | 🔒 Subscribers Only | $66.3 – $105 | $89.7 – $109 |
Stage 1 (Used Wholesale) pricing is member-only. Stage 2 and Stage 3 bands shown above. Premium-AI segments (H100 variants, A40, A100 80GB SXM4) reflect operator-set wholesale anchors; all values in USD per unit.
The Stage 1 (Used Wholesale) layer is the most commercially sensitive tier of The GPU Resource Pricing Survey and is published exclusively to subscribers. Contact info@gpuresource.com to subscribe and unlock Stage 1 access for every tracked GPU model, every issue.
Section 4: GPU Market Pulse Score
The Overall GPU Market Pulse Score of 60.8/100 for the May 26 cycle represents a measured step down from the elevated composite readings in Report #3 — a correction driven almost entirely by the operator-anchored segment’s uniform delta compression rather than by broad-based demand deterioration. Strip out the H100/A40/A100 80GB SXM4 cohort and the FMV-sourced cards tell a more constructive story: consumer Ampere and the V100 are pulling the upper end of the distribution with conviction, while the Ampere data-center tier exerts downward pressure from the middle. The 60.8 reading therefore reflects genuine market segmentation rather than systemic weakness — a market that is healthy in its highest-velocity segments and cautionary in its most capital-intensive ones. The strongest scored segment this cycle is consumer Ampere, led by the RTX 3090 Ti at 77.0 and the RTX 3090 at 76.3, with the V100’s recovery to 75.0 making legacy inference a credible second cluster. The weakest segment is the operator-anchored Hopper and late-Ampere data-center cohort, where all four H100 variants and the A40 cluster between 49.9 and 50.6 — technically in Cautionary territory but held off distressed readings by the private-channel wholesale anchor. The A100 80GB PCIe at 53.9, while FMV-sourced, joins that lower cluster and is the card most at risk of further score deterioration if the −14.9% Stage 3 trend continues into the next cycle.
| GPU Model | Pulse Score | Momentum / Trend |
|---|---|---|
| NVIDIA RTX 3090 Ti | 77.0 — Healthy | Stable (−2.7 vs Issue 3) |
| NVIDIA RTX 3090 | 76.3 — Healthy | Stable (−4.2 vs Issue 3) |
| NVIDIA V100 | 75.0 — Healthy | Stable (+29.8 vs Issue 3) |
| NVIDIA RTX 4090 | 68.2 — Healthy | Declining (+21.5 vs Issue 3) |
| NVIDIA Tesla P100 | 66.8 — Healthy | Declining (+7.6 vs Issue 3) |
| NVIDIA RTX A5000 | 66.0 — Healthy | Stable (−1.7 vs Issue 3) |
| NVIDIA RTX A6000 | 62.5 — Healthy | Stable (+7.2 vs Issue 3) |
| NVIDIA A100 40GB PCIe | 59.7 — Cautionary | Stable (−22.0 vs Issue 3) |
| NVIDIA A100 40GB SXM4 | 54.6 — Cautionary | Declining (−25.2 vs Issue 3) |
| NVIDIA A100 80GB PCIe | 53.9 — Cautionary | Declining (+17.6 vs Issue 3) |
| NVIDIA A100 80GB SXM4 | 50.8 — Cautionary | Stable (−25.0 vs Issue 3) |
| NVIDIA H100 NVL 94GB | 50.6 — Cautionary | Stable (−25.0 vs Issue 3) |
| NVIDIA H100 PCIe 80GB | 50.1 — Cautionary | Stable (−25.0 vs Issue 3) |
| NVIDIA H100 SXM5 80GB | 50.1 — Cautionary | Stable (−25.0 vs Issue 3) |
| NVIDIA A40 | 49.9 — Cautionary | Stable (+18.9 vs Issue 3) |
Scoring Tier Reference
| Score Range | Rating | Interpretation |
|---|---|---|
| 80–100 | Strong — Seller’s Market | Rising or stable prices, high demand — optimal conditions to transact |
| 60–79 | Healthy — Balanced Conditions | Solid demand, prices largely holding — favorable but monitor cycle to cycle |
| 40–59 | Cautionary — Transition Market | Broad price pressure underway — timing matters on declining models |
| < 40 | Distressed — Buyer’s Market | Widespread depreciation, low demand — sell now or accept continued erosion |
The interactive GPU Market Pulse Score tool includes individual model score breakdowns, three-factor detail panels, methodology documentation, and the complete scored ranking across all 15 models. Visit gpuresource.com to access the full interactive analysis.
Conclusion & Market Outlook
The May 26 data package confirms a GPU secondary market that is navigating a structural inflection with more order than the headline delta movements might suggest. Consumer Ampere has solidified its role as the market’s price-stable core — a reliable turn asset for ITAD operators who need predictable liquidation economics. The V100’s cycle recovery adds a second viable tier for operators managing legacy inference supply, particularly as enterprise accounts accelerate decommission timelines amid the broader AI infrastructure refresh that Compliance Standards’ H1 2025 ITAD sector review identified as a defining theme of the current transition period. These are the segments where operators can transact with confidence against published aftermarket ranges.
The data-center GPU tier demands a more granular posture. The A100 80GB family’s concurrent price erosion across PCIe and SXM4 form factors reflects a market repricing toward Hopper-era equilibrium, and the speed of that repricing — particularly the −14.9% Stage 3 trend on the 80GB PCIe — suggests the adjustment is not yet complete. For H100 and A40 transactions, the subscriber-only operator anchor remains the operative reference; the spread between that private-channel floor and public-market pricing is the key risk variable for any operator underwriting a position in those SKUs at Stage 3 levels. The RTX 4090’s entry into declining trend territory is an early-stage signal worth tracking, not yet a liquidation catalyst, but the June 8 issue will be an important data point for confirming whether the 5000-series normalization thesis is beginning to materially weigh on 4090 aftermarket demand.
Looking ahead, the key macro variable for the next two cycles is whether the AI server decommissioning flow — which has been building in volume according to multiple data-center sector observers — translates into a supply surge that overwhelms current demand absorption in the H100 aftermarket, or whether enterprise buyers step in to absorb inventory at or near current private-channel anchor levels. The answer will define whether the 50-point Pulse Score cluster currently occupied by Hopper GPUs represents a floor or a transition point to further compression.
GPU Pulse Market Report #5 publishes on or around June 8, 2026. The editorial team will be tracking the RTX 4090’s declining trend for reversal or acceleration, monitoring whether A100 80GB price erosion stabilizes or deepens, and assessing the first full two-week dataset under the bi-weekly publication cadence — including any mid-cycle operator anchor adjustments on H100 and A40 segments that materialize before close of the survey window.
Data Methodology & Sources
Private Aftermarket Data (Core Survey)
- Source: The GPU Resource Pricing Survey — peer-to-peer aftermarket transactions, 30-day lookback
- Metric: Median price per unit from recent transactions per GPU model
- Condition filter: Used only; tested, functional, Grade A cosmetics
Used Wholesale Estimates (Member Access)
- Stage 1 (Used Wholesale) pricing is published exclusively to The GPU Resource members
- Methodology: Stage 2 median discounted by 25% (high-activity models) or 35% (thin-market models)
- Premium-AI segments use operator-set wholesale anchors (H100 variants, A40, A100 80GB SXM4)
- Criteria: 5–10 unit purchase, tested & functional, Grade A cosmetics, USD per unit
- Subscribe at info@gpuresource.com to unlock Stage 1 across all 15 tracked GPUs
GPU Market Pulse Score
- Composite of three factors: Price momentum/stability (50%), Demand level (40%), Liquidity (10%)
- Bi-weekly cycle; momentum measured against the prior issue’s private aftermarket median
- Full methodology available at gpuresource.com
© 2026 The GPU Resource. All rights reserved. This report is provided for informational purposes only and does not constitute an offer to buy or sell any asset. Values reflect market conditions as of May 26, 2026.